Data analysis is the process of manipulating data with a set of software tools and techniques to extract valuable information. This information can be used to answer a specific question, uncover hidden relationships within the data, or even predict future events.
Data analysts, like detectives, meticulously examine their data to identify what information can be gleaned and how to utilize it for the ongoing investigation.
Data analysis is a powerful tool that empowers decision-makers across all fields — agricultural, industrial, service, and entertainment — by granting them deeper insights and enabling them to make wiser, data-driven decisions.
Let’s illustrate the power of data analysis with a real-world examples:
- Answer a Question: Imagine we want to investigate if there’s a link between smoking and the severity of COVID-19 symptoms. Data analysts would gather information on COVID-19 patients, including their smoking status. Through appropriate analysis tools, they can identify any potential relationship between these factors. This type of analysis is called descriptive analysis.
- Predicting the Future: Data analysis can forecast future events, like weather. By training machine learning models on historical weather data, analysts can predict the weather for the coming days with reasonable accuracy. This type of analysis is called predictive analysis.
- Unveiling Hidden Patterns: Data analysis excels at uncovering hidden relationships within data. Take social media influencers, for instance. By analyzing their data, we can employ clustering algorithms to group similar influencers. These groupings can reveal hidden patterns, such as shared content themes, audience demographics, or even engagement strategies. This type of analysis is called cluster analysis.
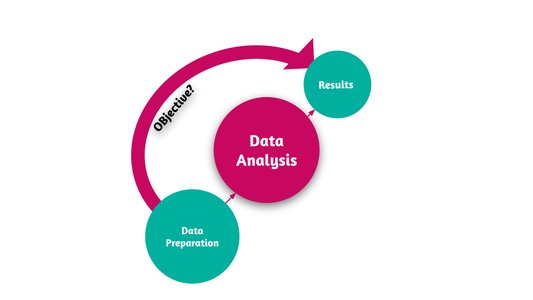
What Is the Data Analysis Process?
The data analysis process can be broken down into four key stages:
1- Define the Objective
Every data analysis project starts with a clear objective. What question are you trying to answer? What problem are you trying to solve? A well-defined objective ensures you collect the right data, use the appropriate techniques, and ultimately, derive valuable insights.
2- Data Preparation
Before diving into analysis, raw data needs to be prepared. This stage involves gathering data from various sources, cleaning it to remove inconsistencies or errors, and transforming it into a consistent format. Imagine a chef preparing ingredients before cooking , this stage gets your data ready for analysis.
3- Data analysis
According to your objectives, you choose the most suitable analysis tools and techniques. These can include predictive analytics, descriptive analytics, and diagnostic analytics. Analysis can produce two main types of insights: visual (charts and graphs) and textual (reports, tables, summaries).
4- Draw Conclusions and Communicate Results
The final stage involves interpreting your analysis results and drawing conclusions. Did you identify any trends? Can you answer your initial question? Perhaps you even disproved a hypothesis! Once you have these insights, you need to communicate them to decision-makers in a way that’s clear and actionable.
Data analysis is a well-established field, but it also has a creative side. Why? Because figuring out the right questions to ask, selecting appropriate analysis techniques, and interpreting results all involve a degree of creativity and critical thinking.